
Giboulées™
In the spring in the alps, warm bright sunshine can be interrupted abruptly by torrential rain, sleet, snow and bright sunshine again, all in the same hour. The French call these giboulées. Topsy turvy, market up, market down, chaotic disruptions. We focus on building portfolios that provide a good return and relative calm through any series of changes, these are our Giboulées™

A PROPRIETARY ALGORITHM —
Our Giboulées™ portfolios aim to provide good return and relative peace in any environment
In designing the Giboulées™, we are dedicated to using cutting edge financial theories, data sciences, and optimization techniques to build portfolios that have proven to be efficient at absorbing past market shocks.
Our process follows:
Efficient market Theory (Eugene Fama), investing mostly in inexpensive passive asset classes
Factors of Returns Theory (Eugene Fama Nobel Prize Economics 2013), so we tend to favor asset classes that emphasize small size, value, profitability and momentum. We use Dimensional Funds as well as other providers.
Modern Portfolio Theory (Harry Markowitz Nobel Prize Economics 1990), our algorithm effectively finds an Efficient Frontier, a family of portfolios showing maximum historic returns at any chosen volatility.
The same portfolio optimization tool as explained in Our Services
We follow a Risk Parity approach in that:
We embrace cautious use of leverage applied to diversified portfolios
We reject modelling and correlating the performance of asset class returns and volatility and the interdependence of asset classes.
No normal distribution of return assumptions, no fitting of covariance coefficients, these methods introduce substantial errors.

THE INPUT —
The input of our algorithm is the series of total monthly returns for each chosen asset class for a period of 20 years or longer. For example, if we want to run our algorithm now (August 2020) to include DFREX (US real estate index fund by Dimensional Funds) we need to collect
R1 is the total monthly return of DFREX in August 2000
R2 the total monthly return of DFREX in September 2000
R240 the total monthly return of DFREX in July 2020
A series of at least 240 data points: (R1,R2,R3…..R240)
We purposely choose a time frame around 20 years or longer because our goal is to find portfolios that behave well over a wide range of market conditions. The past 20 years currently include three dramatic stock market crashes, each of very different nature, a variety of interest rate environments, several economic cycles.
Note that this choice of 20 years is a big constraint on the type of asset classes we can feed to our algorithm. DFREX is not a problem because this fund is more than 20 years old, so the data are easily available. However a lot of interesting asset classes have not been available for that long. For us to be able to consider an asset class, we need to be able to reliably extrapolate its past performance for the last 20 years. In practice this limits us to passive asset classes that are duplicating an index for which we can collect 20 years or more of performance data.
Which asset classes do we consider?
We like to consider as broad a range of classes as we can. The broader the range the better the diversification can be. US real estate, non US real estate, US stock (with a lean on various factors of return), International, Emerging market stocks, International bonds, US corporate bonds, US treasuries (of various duration), Treasury Inflation Protected Securities, commodities; all these classes can be considered. But also, leverage, in the form of margin debt can be considered as an asset class. We can reliably extrapolate the interest of margin debt for each month of the last twenty or more years.
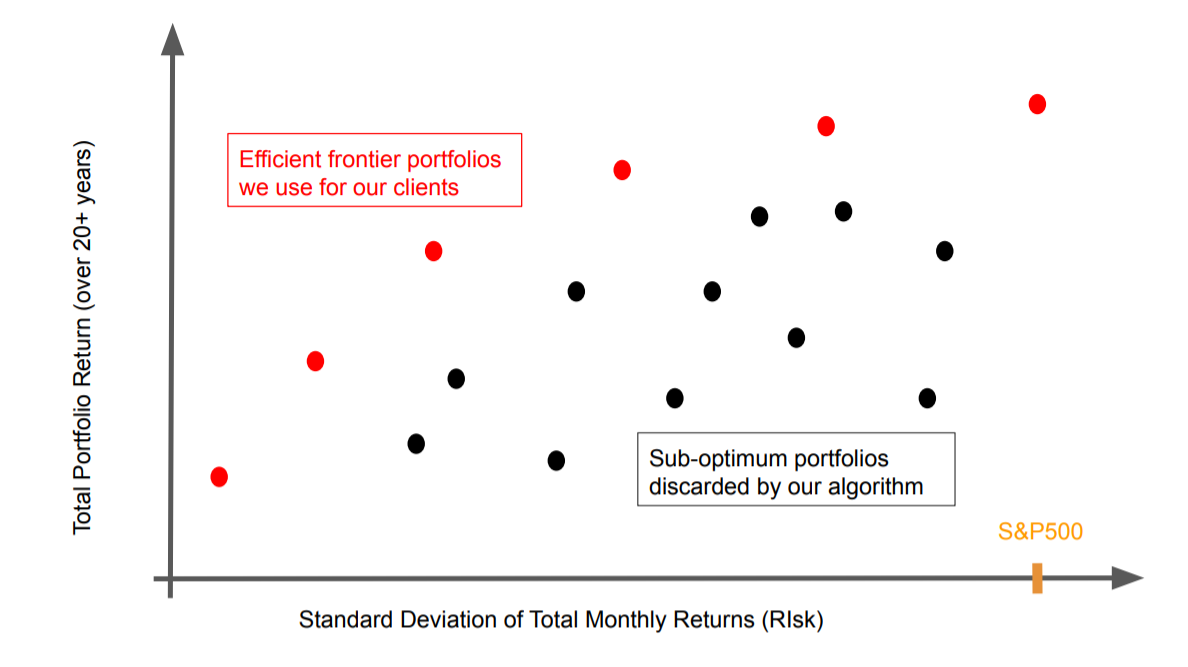
The Output
The output of our algorithm is the efficient frontier corresponding to all the asset classes provided as input. An efficient frontier is a family of portfolios, each with a very specific composition of the asset classes (including margin debt) we considered as input, each providing the highest historic return at their specific volatility. This family of portfolios is, by design, offering a very broad range of historic volatility so we can cater to all sorts of risk attitudes of our clients. We call these portfolios Giboulées™. Note that the highest volatility portfolios we design have a volatility always around that of the S&P500 for the same time period considered. None of the portfolios we design are riskier than that.
_________________________
It turns out that a significant contribution to that efficient frontier is the use of leverage. We share this observation with the founders of the Risk Parity approach. It is important to note that leverage in and of itself does not mean increased risk. Reasonable leverage is used here to boost returns of very stable portfolios. Actual risk is better grasped by the standard deviation of total monthly return on equity, which is the x axis of our graphs. Also note that historically none of the portfolios we use come anywhere near margin call over the past 20+ years, and that period includes three rather dramatic equity crashes. Not all accounts can implement portfolios with leverage. IRAs in particular do not allow leverage. For this reason our algorithm produces not one but two efficient frontiers, one that uses leverage and one that doesn’t.